How to Activate Gantt Chart
Gantt Chart is a type of bar chart that allows you to see the schedules of each and every task created within your project by WP Project Manager Pro. This document will show you how to use the features of the Gantt Chart.
Activation
To activate the Gantt Chart Module, go to WP Admin Dashboard → Project Manager → Modules → Activate the Gantt Chart.
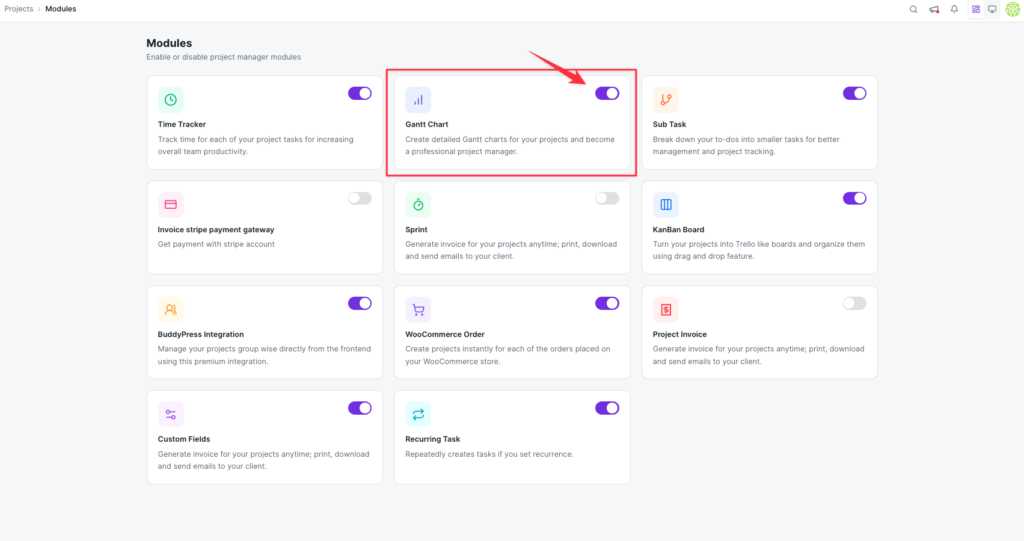
Location of Gantt Chart Module in WP Project Manager
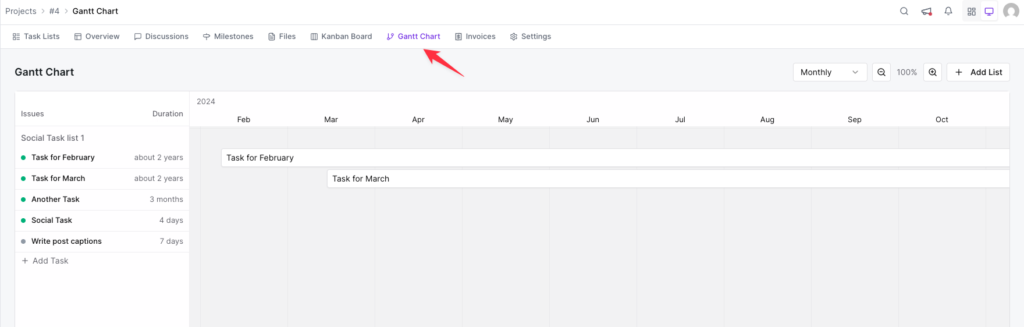
To access your Gantt Chart, go to Project Manager → Projects → Select any project you wish to view.
After selecting the project of your choice, you will see the Gantt Chart on the far right side of the menu. Click on it to view.
Expand the Duration of the Tasks
Gantt Chart allows you to expand the duration of tasks. At the top, you will see the date, day, and month. You can expand your tasks by dragging them to the left or right by clicking and holding the edges of the tasks.
Interestingly, you do not have to edit the due dates for the project or tasks, the due date for any task will be changed according to the graphs.
Move Tasks to Any Date
If you want to push a specific task to a later or an earlier date, you need to click and hold the task and then drag and drop to your desired date.
For example, the first task was supposed to be done from the date 6 to the date 7 but after moving it we can see that it is due from the date 8 to the date 9. Here is a screenshot:
If you click and hold on a task list and drag it to the right then the due date will be extended. Similarly, if you click and hold on a task list and drag it to the left then the due date will be shortened accordingly.
Add a New Task or Task List while Keeping It Categorized
But, with the Gantt Chart, you can create new tasks right from the Gantt Chart tab.
Simply hit on the + icon from under the Action (caption) category to create a new task while keeping it categorized:
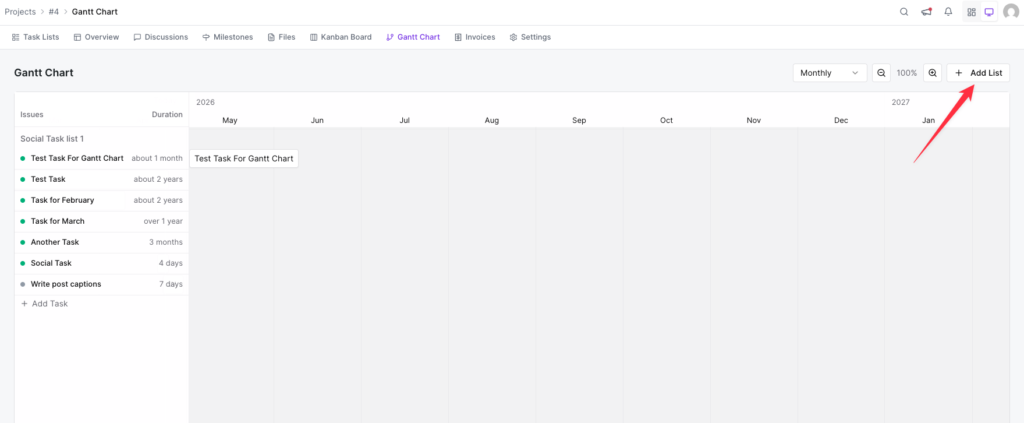
Adding Task List
However, to add a Task List, you can use the first (+) icon right from the Topbar to create a Task List directly:
That's it.