

How to Use Gantt Charts to Schedule Projects of Any Size
Keeping a project on schedule is one of the biggest challenges in any workflow, whether you're a solo freelancer or leading a team. Deadlines shift, priorities change, and tasks often get buried in spreadsheets or scattered to-do lists. You need a clear, visual map of your entire project timeline that shows what needs to happen, when, and in what order.
Few tools are better at this than a Gantt chart. And if you manage projects with WordPress, WP Project Manager Pro makes it easy to bring Gantt-style planning into your workflow. It's the Gantt Chart module that lets you visualize, schedule, and track projects of any size, all from your WordPress dashboard.
In this post, you’ll learn what Gantt charts are, why they matter, and how WP Project Manager helps you streamline project scheduling from start to finish.
What Is a Gantt Chart and Why Does It Matter?
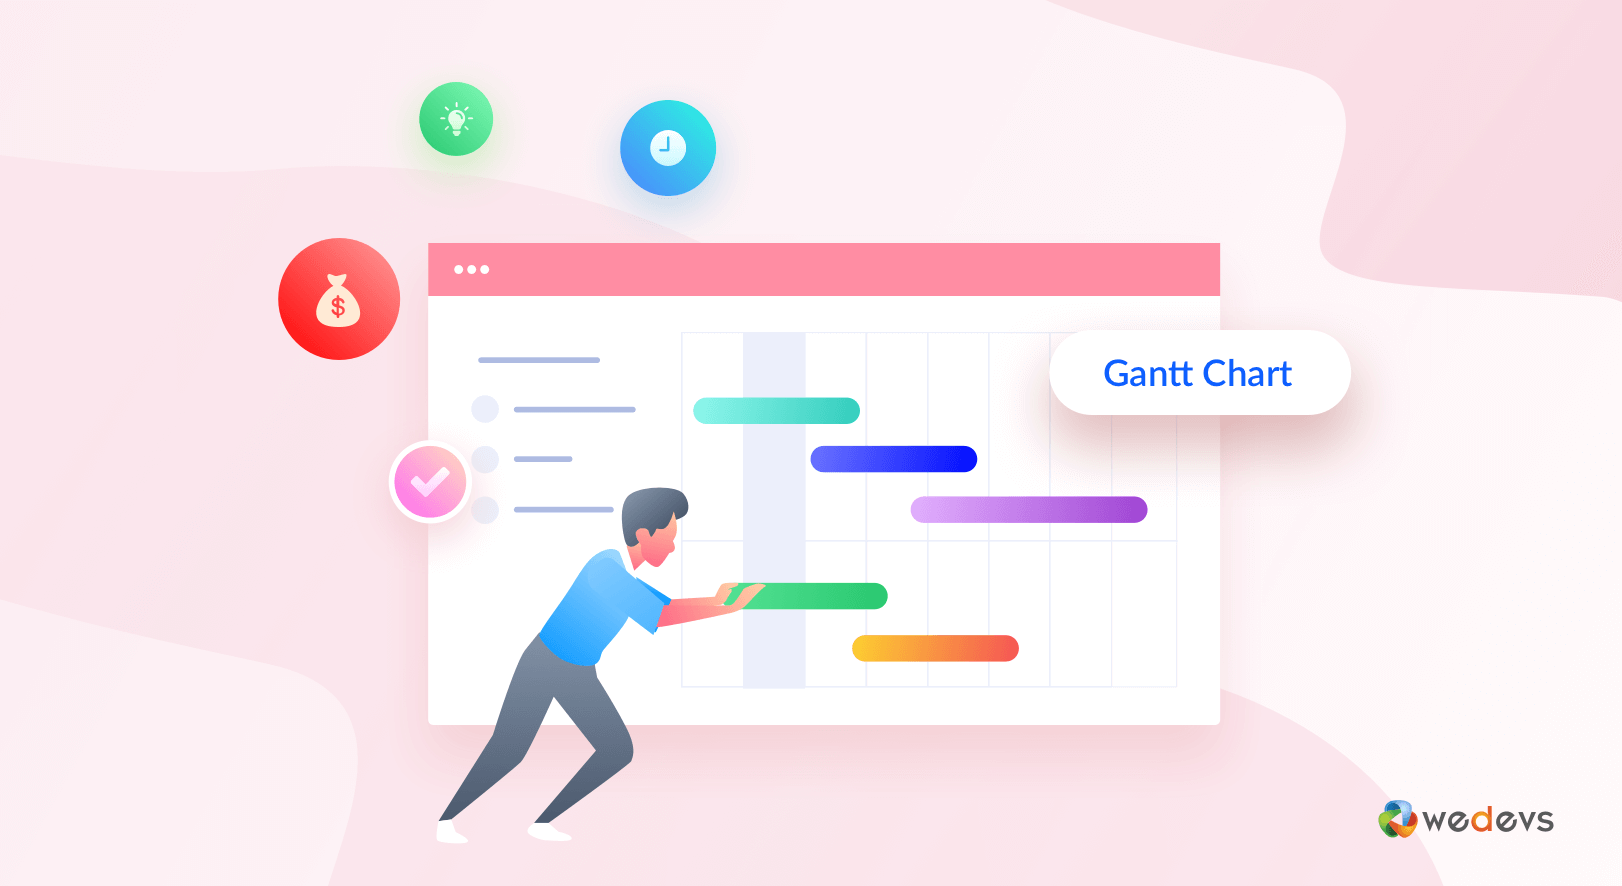
A Gantt chart is a type of bar chart that displays your project schedule over time. Each task is shown as a horizontal bar, with the position and length of the bar indicating the start date, duration, and end date of the task. It is one of the most effective ways to plan, organize, and monitor projects.
Here’s what makes Gantt charts so valuable:
- Visual clarity. You get a clear overview of all tasks, their durations, and how they fit into the overall project timeline.
- Dependency tracking. You can link tasks to reflect the order in which they must be completed.
- Progress monitoring. A Gantt chart can show how much of each task is completed at a glance.
- Team coordination. Everyone involved can see their responsibilities and deadlines in one place.
Whether you’re managing one project or coordinating across teams, this tool helps you stay organized and in control.
Key Features of the WP Project Manager Gantt Chart
If you’re using WP Project Manager Pro, the Gantt Chart module gives you a powerful way to organize and visualize your project timelines within WordPress. It offers the core benefits of traditional Gantt charts, along with modern, interactive features that make planning more flexible. Let's have a look at the key features of WP Project Manager Gantt Chart.
1. Visual Overview
The Gantt Chart provides a complete visual summary of your project. You can quickly see when each task starts and ends, how much progress has been made, and what is coming up next. This helps you identify delays or bottlenecks early.
2. Interactive Planning
The chart is fully interactive. You can:
- Drag and drop tasks to new dates
- Extend or shorten task durations
- Adjust scheduling with a simple click
- Update progress directly within the timeline
This makes it easy to manage changing priorities or timelines without extra steps.
3. Collaboration Across the Team
Team members can manage their assigned tasks from within the Gantt view. They can create new tasks, adjust due dates, and update progress without switching to another screen. This keeps everyone aligned and reduces communication gaps.
4. Cross-Project Task Creation
Tasks can be created from other projects right inside the Gantt Chart. This is useful for teams that work across departments or projects that depend on shared resources.
5. Grouping and Linking
You can group tasks under organized categories and link tasks to indicate dependencies. For example, if one task cannot begin until another is completed, you can link them to reflect that relationship. This helps you build a clearer project roadmap.
How to Use the Gantt Chart Module in WP Project Manager Pro
The Gantt Chart module in WP Project Manager Pro helps you map out your entire project visually using a timeline-based layout. Each task appears as a bar on the chart, giving you a complete overview of what’s happening, when it’s scheduled, and how it’s progressing. Here’s how to activate and use it step by step.
Requirements: This module is included in the Professional and Business plans of WP Project Manager Pro.
Step 1: Enable the Gantt Chart Module
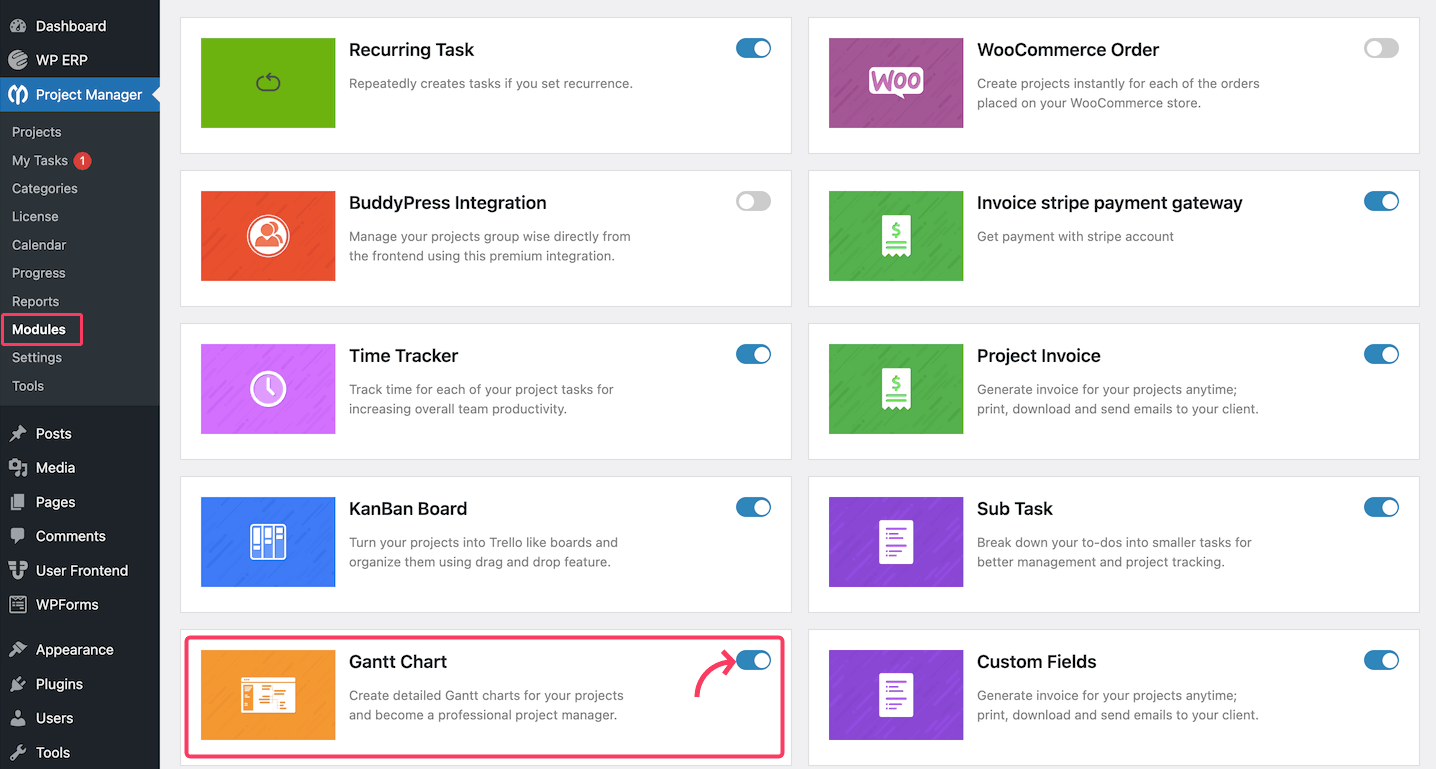
Before you can use Gantt Charts, you need to activate the module:
- Navigate to your WordPress dashboard
- Go to Project Manager → Modules
- Find the Gantt Chart module and click the Toggle button
Once enabled, the feature becomes available within your individual project views.
Step 2: Access the Gantt Chart View
To find your Gantt chart, Head to Project Manager → Projects. Choose the project you want to view. From the top-bar menus, click Gantt Chart.
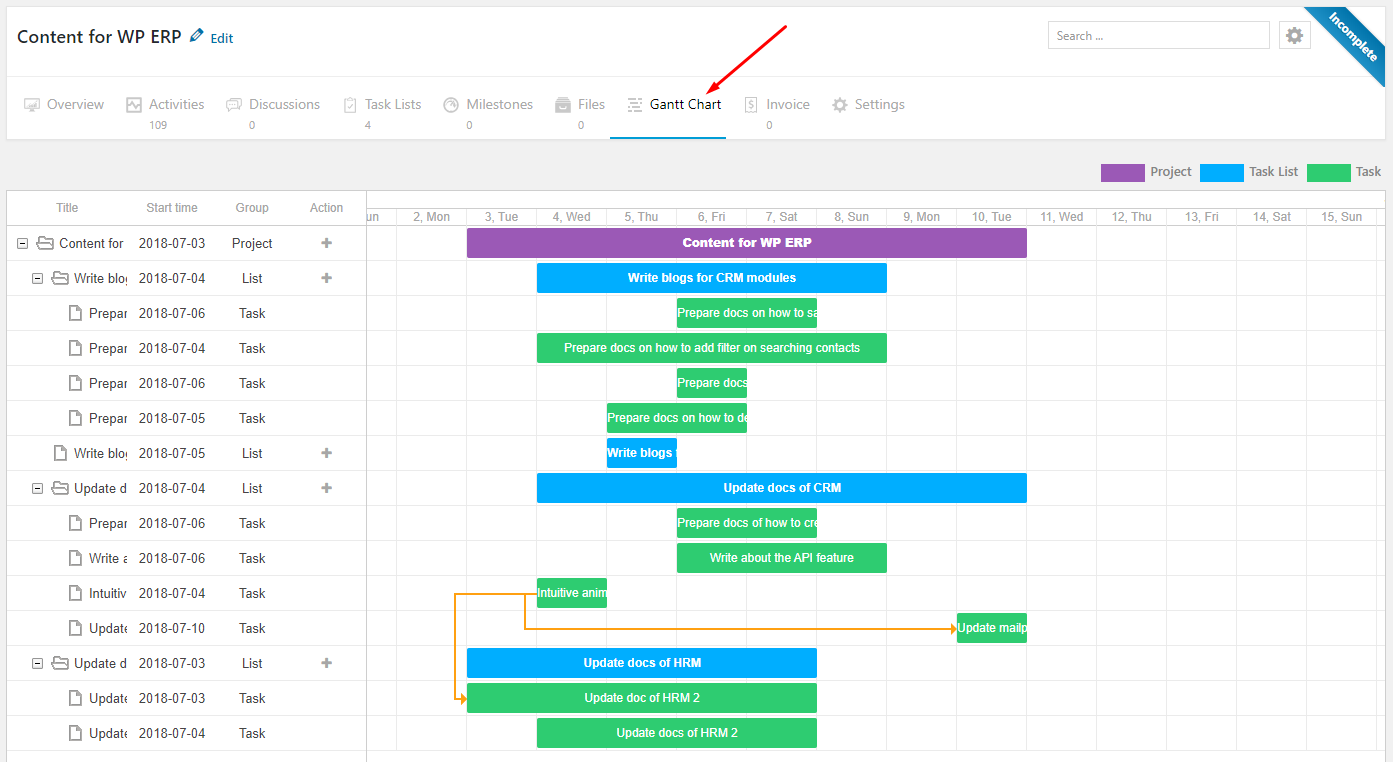
You’ll now see a visual timeline of all tasks associated with that project.
Step 3: Adjust Task Durations Visually
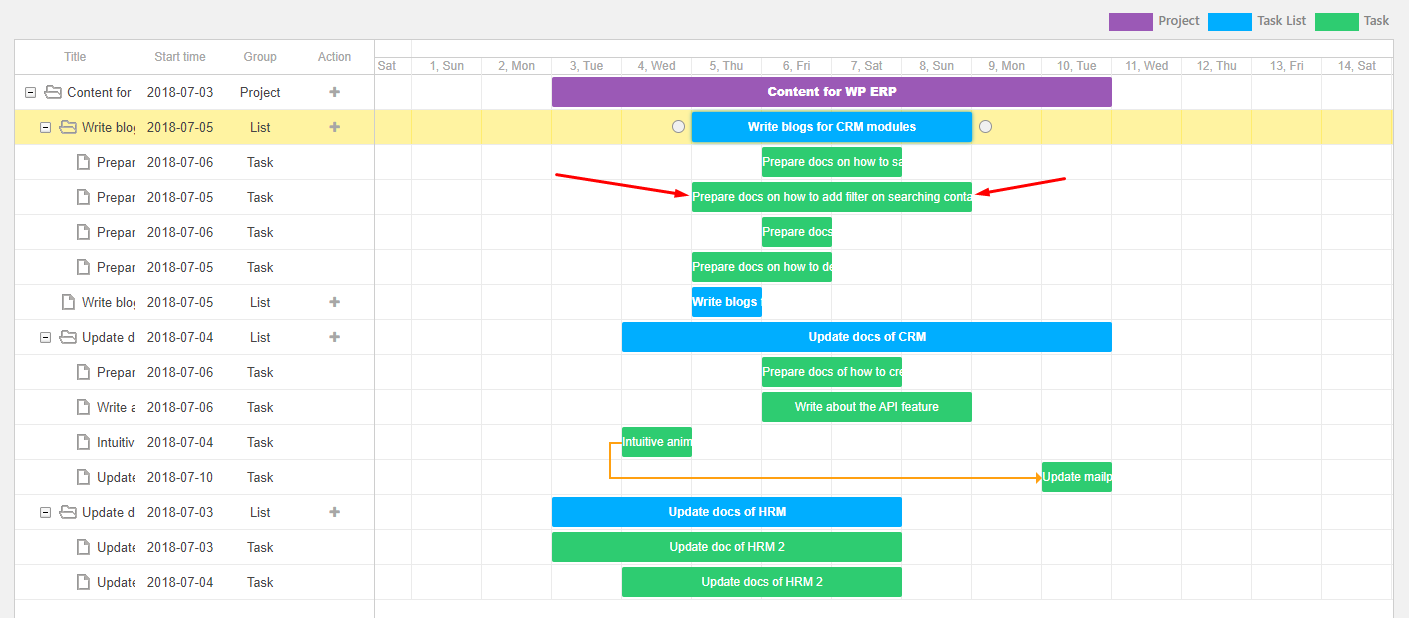
Each task appears as a bar stretching across the timeline. You can easily change the duration of a task by dragging its edges left or right. As you adjust the bar, the start and end dates automatically update, so there is no need to manually edit deadlines.
Step 4: Move Tasks to New Dates
To shift a task to a new point in the timeline:
- Click and hold the taskbar
- Drag it to the desired date range
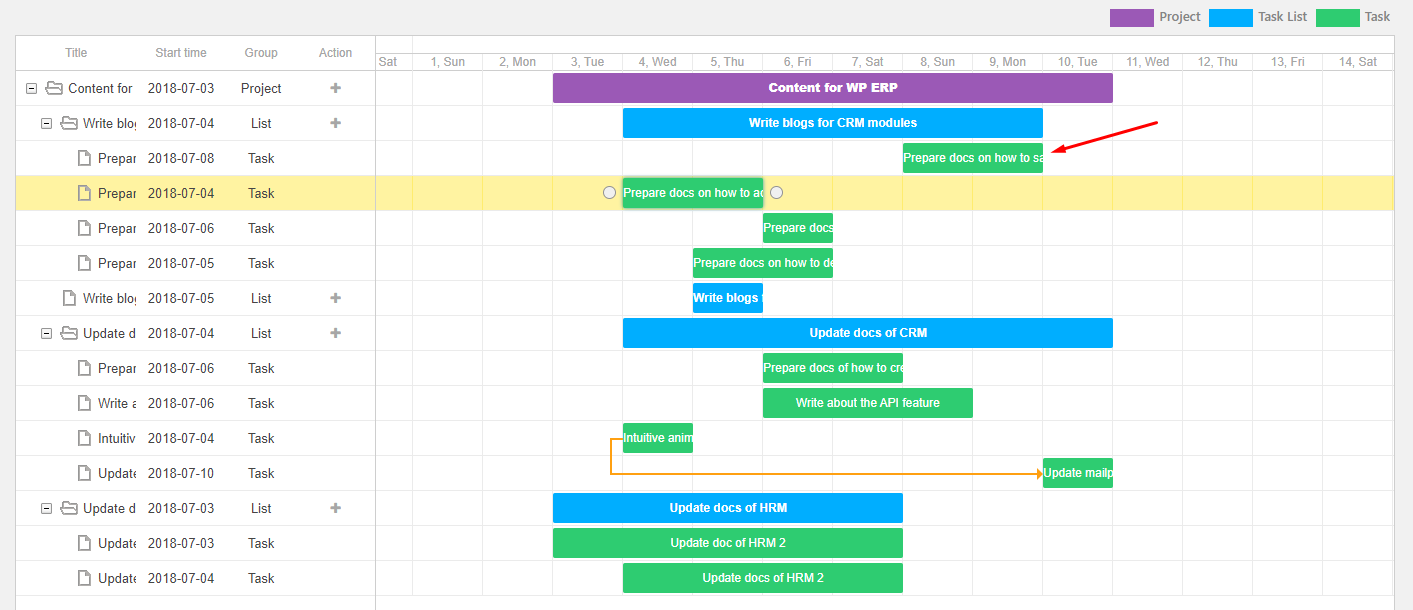
This feature is ideal when deadlines change or when tasks need to be rescheduled quickly. You can also shorten or extend the task’s duration the same way, by dragging either edge of the bar.
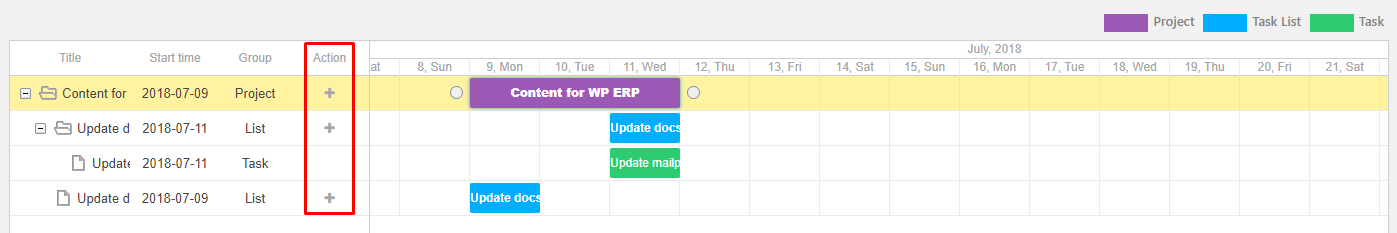
Step 5: Add New Tasks and Task Lists
You don’t have to leave the Gantt Chart view to add new tasks. Just click the + icon under the Action column to create a new task within the existing list.
After clicking the plus icon, a form will pop up where you can:
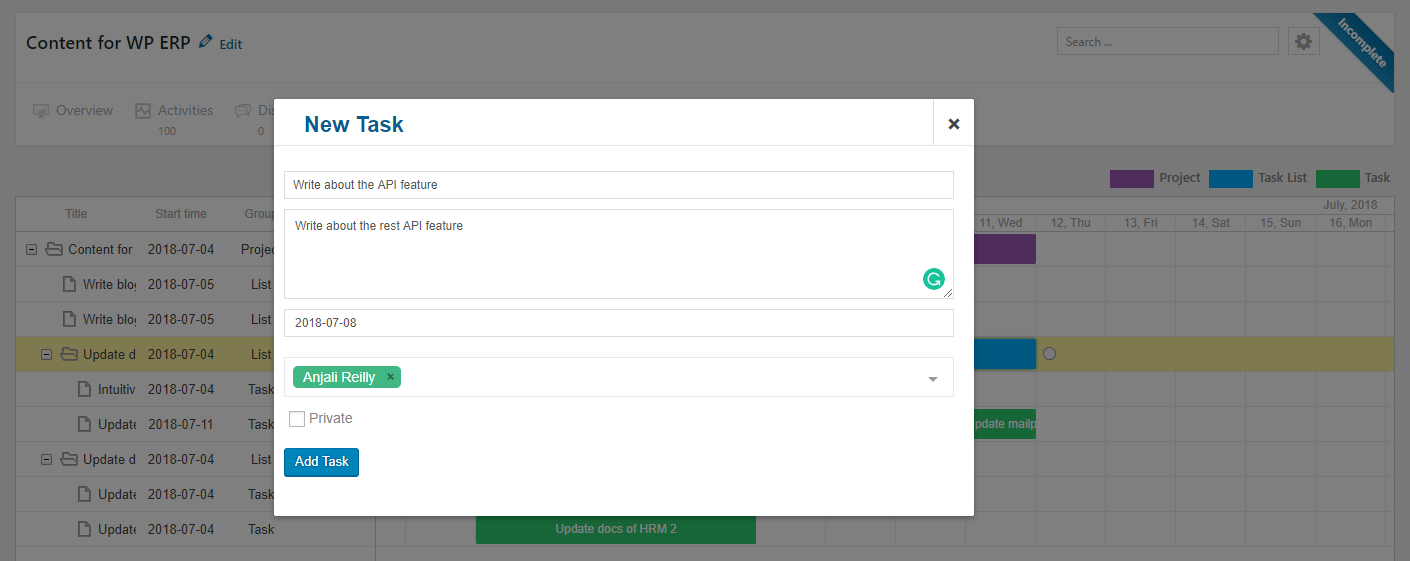
- Enter the task or list name
- Assign it to a user
- Set a due date
- Mark it as private (if needed)
Step 6: Link Tasks Together
You can create dependencies between tasks by linking them visually. Click on a taskbar to reveal two small circular icons at its ends. Click and drag from one of the icons to another task’s icon to create a link.
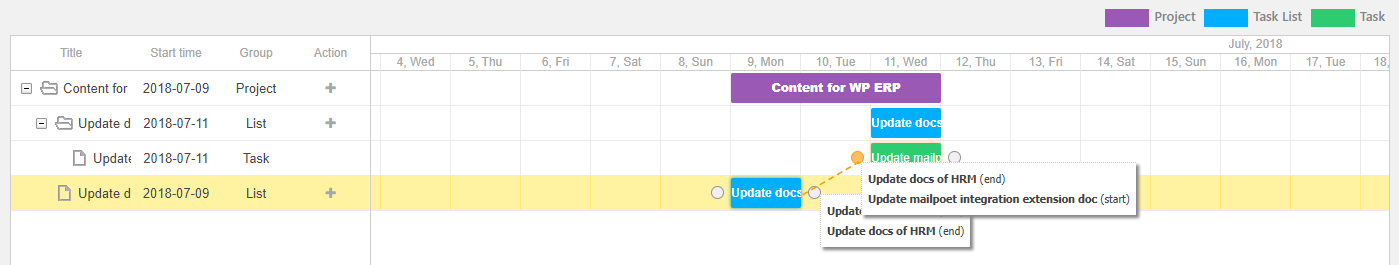
Note: You can only link tasks in forward order (from earlier to later). Reverse linking is not allowed.
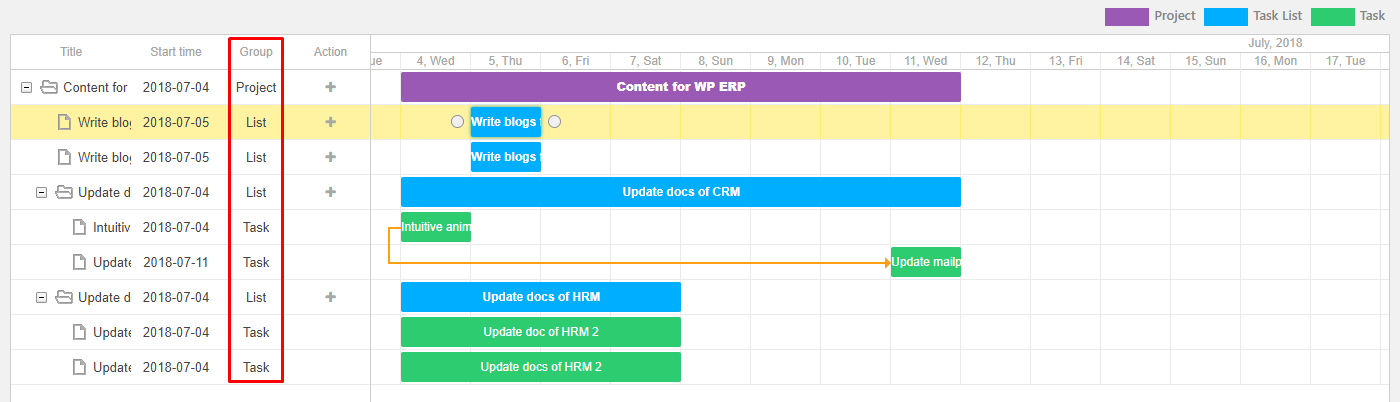
Step 7: Use Grouping for a Clearer View
Since version 2.0.1, the Gantt Chart includes a Group feature. This allows you to see a breakdown of which project includes which task lists and tasks. It’s especially useful for organizing complex projects. Here's a snapshot of this feature:
Step 8: Double-Click to Edit Task Details
To view or update a task or task list, simply double-click on it. A detail window will appear where you can:
- Edit the name, due date, assignee, and more
- Save changes by clicking the Update button
Note: Double-click editing is only available for tasks and task lists, not entire projects.
Step 9: Monitor and Update Progress
As work gets done, update the progress of each task directly from the Gantt view. This keeps the chart accurate and helps you quickly spot any delays.
Tip: Encourage your team to update their own tasks regularly. This keeps everyone informed and the chart current without requiring manual oversight.
You can read the full doc here: How to Activate Gantt Chart.
Real-World Use Cases of Gantt Charts in Project Management
The Gantt Chart module in WP Project Manager Pro is flexible enough to support a wide range of work styles and industries. Here’s how it can fit into your workflow.
Freelancers: If you handle client projects on your own, staying organized is critical. Gantt charts help you:
- Break down client work into manageable steps
- Schedule tasks around client deadlines and your availability
- Track progress across multiple projects without feeling overwhelmed
Example: A freelance designer can use the Gantt Chart to map out each phase of a branding project, from research to final delivery, ensuring nothing slips through the cracks.
Agencies: When you're managing multiple clients or departments, visibility is key. The Gantt Chart lets you:
- View project timelines side by side
- Assign tasks to different team members with clear deadlines
- Coordinate dependencies between designers, developers, and content creators
Example: A digital agency running campaigns for several clients can use the Gantt Chart to allocate resources efficiently and make sure work across departments stays aligned.
Product Teams: Product development often involves overlapping tasks and tight release schedules. Gantt charts make it easier to:
- Break product goals into development sprints or milestones
- Link related tasks across engineering, design, and QA
- Monitor release readiness at a glance
Example: A software team can organize their roadmap visually, track each feature's progress, and adjust timelines as priorities shift.
Best Practices for Using Gantt Charts to Manage Your Product

Gantt charts are powerful, but like any tool, they work best when used with the right strategy. Here are a few tips to help you get the most value out of the Gantt Chart module in WP Project Manager Pro.
1. Define the Scope Before Building the Chart
Before you start adding tasks, be clear be clear about the project’s goals, deliverables, and deadlines. Knowing what needs to be done helps you build a more accurate and actionable timeline.
2. Break Work Into Clear, Measurable Tasks
Avoid vague to-dos. Each task should have a specific outcome, a start and end date, and someone responsible for it. This helps your chart reflect real progress rather than rough estimates.
3. Use Task Dependencies Wisely
Link tasks that rely on one another to create a more realistic schedule. This prevents teams from starting work before the groundwork is in place and keeps the entire timeline aligned.
4. Keep the Chart Updated
A Gantt chart is only as useful as it is current. Encourage your team to update their tasks regularly or review the chart at least weekly to reflect new developments.
5. Don’t Overload the Timeline
It can be tempting to cram every tiny detail into your Gantt chart, but that can quickly lead to clutter. Focus on key tasks and milestones that impact the broader schedule.
6. Use Color and Grouping for Clarity
Group related tasks and use color coding (if supported by your theme or custom styles) to distinguish phases, teams, or departments. This makes the chart easier to scan and interpret.
7. Review and Adjust Regularly
Use the Gantt chart as a living document. As new priorities emerge or delays happen, adjust the timeline accordingly to stay on track and reduce stress.
Plan Smarter, Stay on Track with Gantt Charts
No matter the size or complexity of your project, clarity is key and that's exactly what Gantt Charts bring to the table. With WP Project Manager Pro’s Gantt Chart module, you can stop guessing and start planning with confidence. Move tasks, adjust timelines, create dependencies, and visualize your entire workflow, all from one intuitive interface inside WordPress.
Ready to simplify your project planning? Try the Gantt Chart module in WP Project Manager Pro and see how it transforms the way you work.