

Reports
The Reports Module is being introduced with WPUF v2.9.0.
This module shows you 4 types of reports:
- User Report
- Post Report
- Subscription Report
- Transaction Report
Navigation
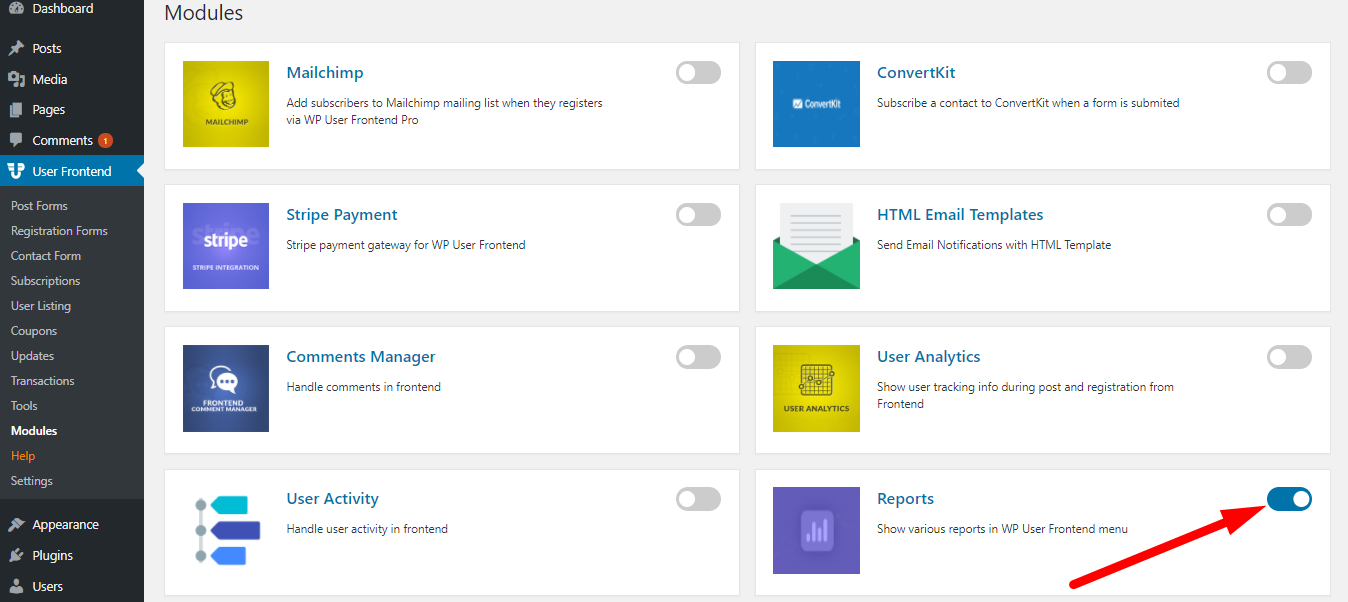
Navigate to wp-dashboard→User Frontend→Modules. Turn on the toggle button for Reports.
Configuration & Use
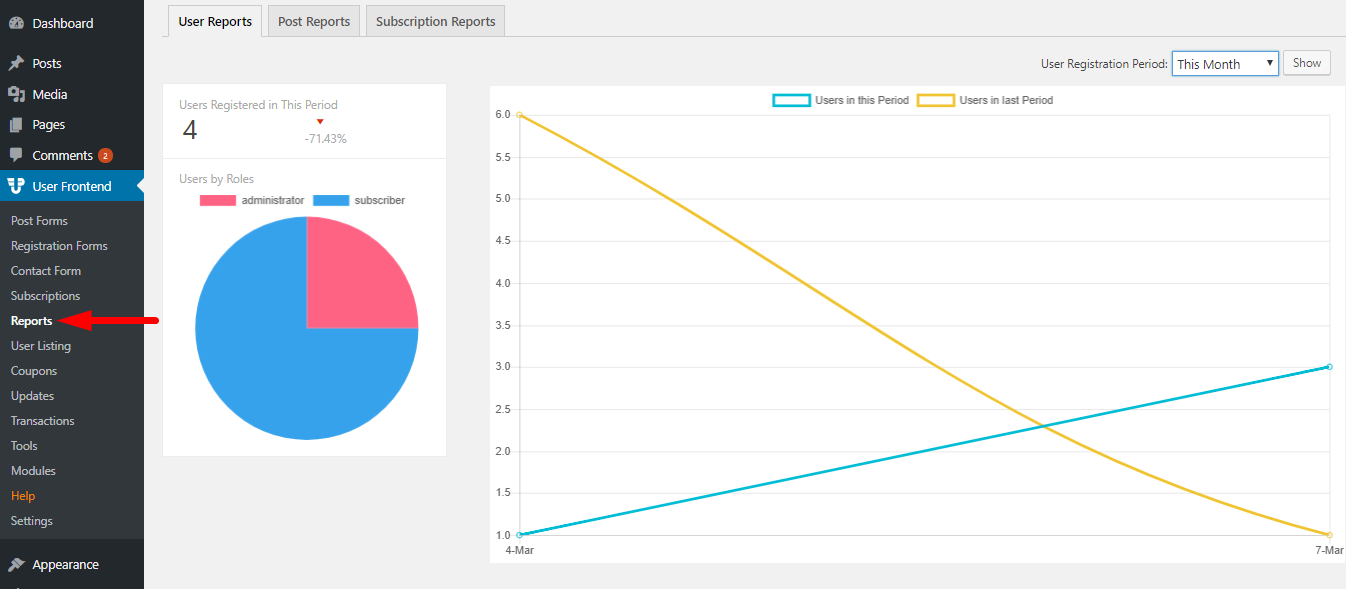
After turning on the module, a new menu for Reports will appear in the sidebar:
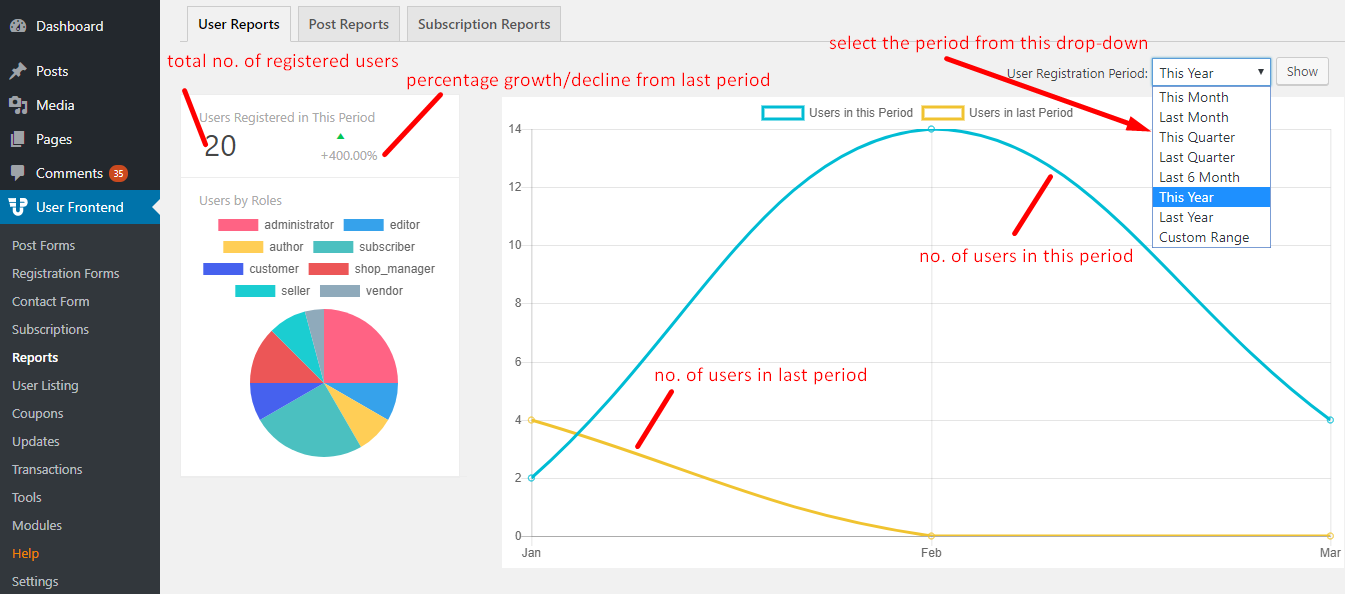
The first step to view a report according to your needs is to select the period for which you want information.
All reports can be filtered in 8 ways.
You can choose from:
- This Month
- Last Month
- This Quarter
- Last Quarter
- Last 6 Month
- This Year
- Last Year
- You can also choose a Custom Range.
The drop-down is located at the top-right of every report. Once you have selected the period, click on Show.
User Reports
The User Report shows the following information:
- Number of total registered users in your site in this period.
- Pie chart comparing the number of users by their roles in your site.
- Labels and colours indicating the different user roles.
- Percentage growth/drop of total number of registered users as compared to last period.
- Graph comparing the total number of registered users in last period [yellow curve] and this period [blue curve].
Post Reports
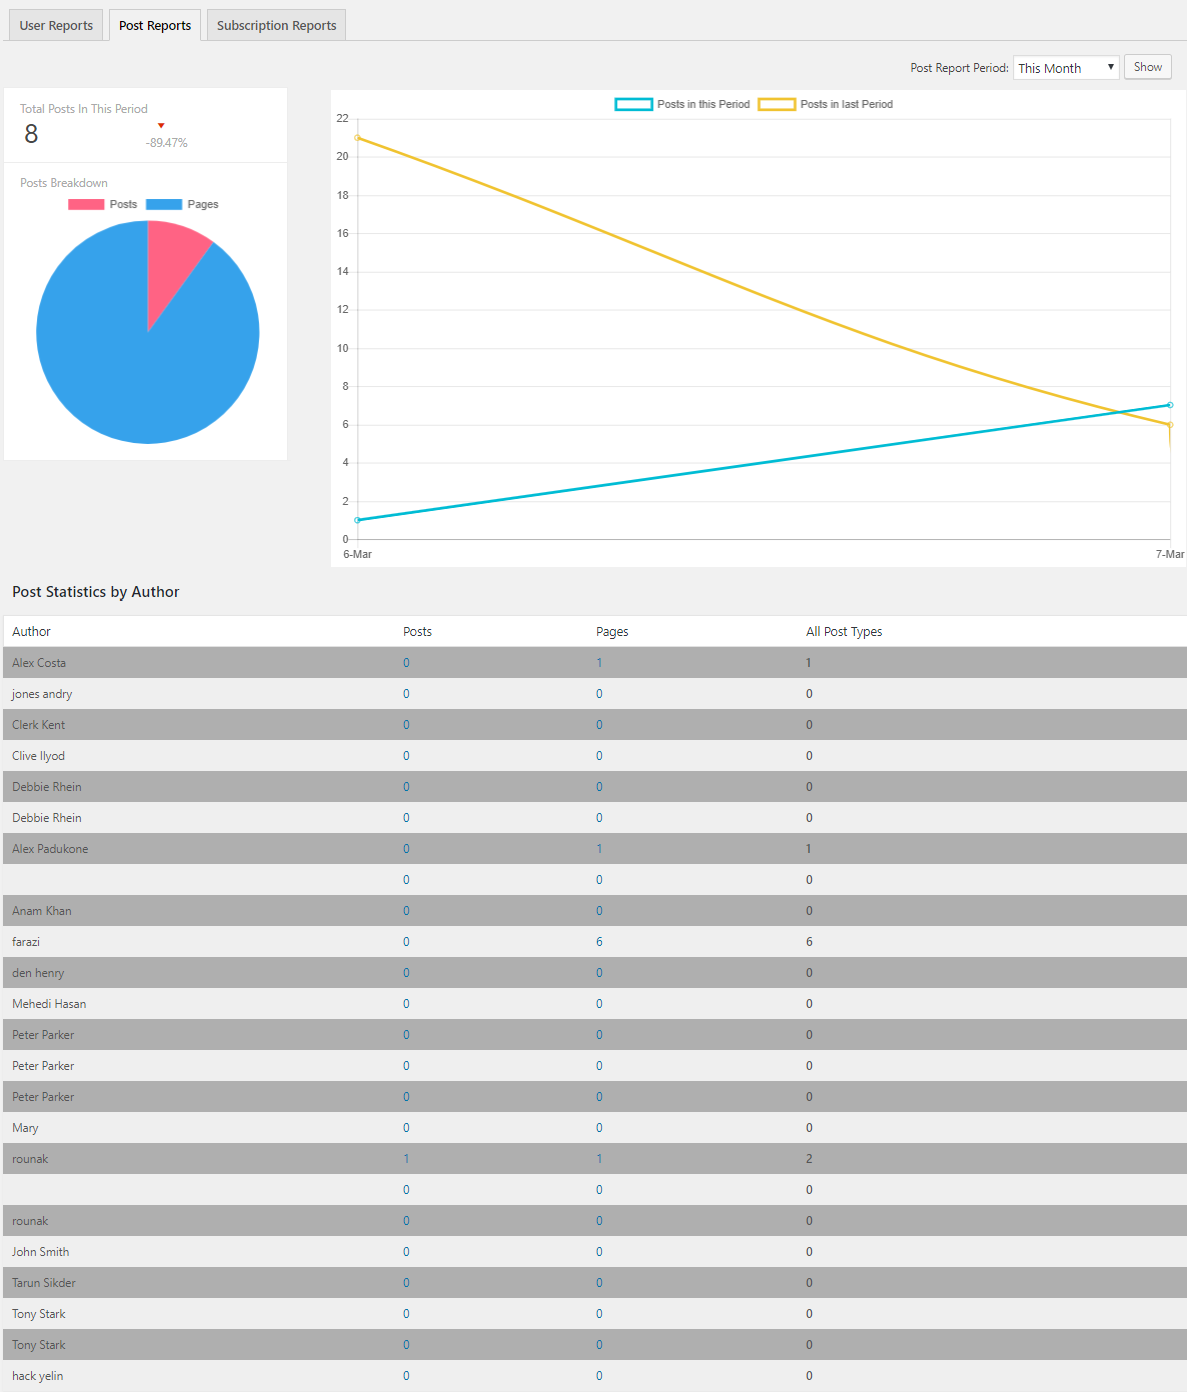
Post Reports show the following information:
- Total number of posts
- Total number of pages
- Number of all post types
- Pie Chart showing breakdown of all post types
- Graph showing number of all posts last period [yellow curve] and this period [blue curve].
- View number of posts and pages created by each author
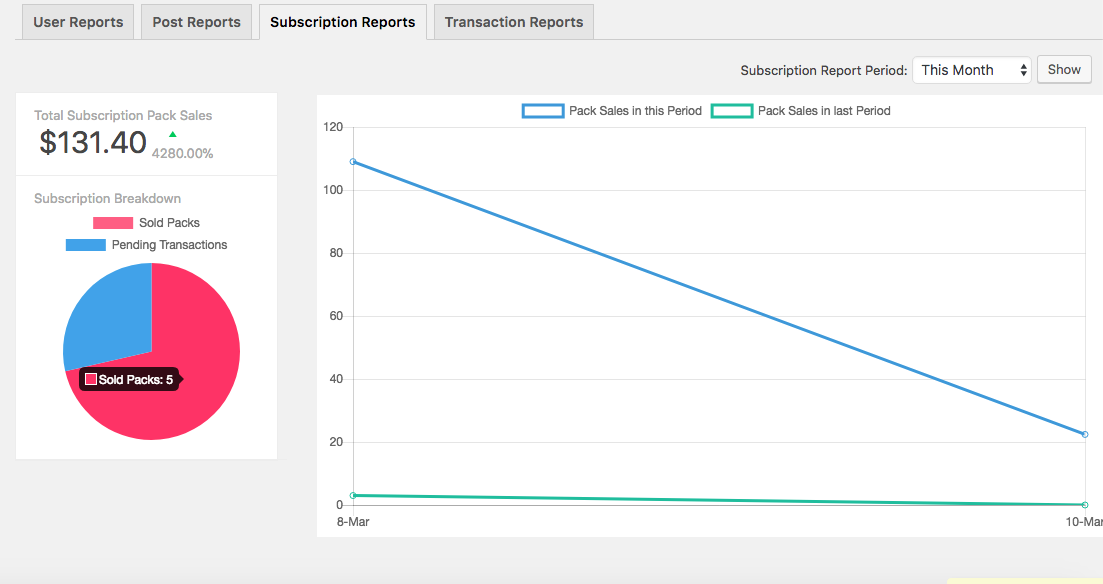
Subscription Reports
Subscription Reports contains the following information:
- Total amount of subscription pack sales
- Pie Chart breakdown of total sold packs and total pending transactions
- Graph showing Pack Sales in this period [blue curve] and pack sales in last period [green curve]
Transaction Reports
Transaction Reports show you the following information:
- Total Sales (with tax)
- Tax Amount
- Net Income (the amount excluding tax)
- Curve showing Sales in this period [blue curve], Tax in this period [green curve] and Sales in last period [light green curve]
That's all about WPUF reporting!